RocketMQ Promethus Exporter
簡介
Rocketmq-exporter 是一個用於監控 RocketMQ 代理端和用戶端側所有相關指標的系統,它將透過 mqAdmin 從代理端側取得的指標值封裝到 87 個快取中。
在之前的版本中,有 87 個 concurrentHashMap,但由於 Map 沒有刪除過期的指標,一旦標籤發生變更,就會產生一個新的指標,而舊的、未使用的指標無法自動刪除,最終導致記憶體溢位。然而,使用 Cache 結構可以啟用過期刪除,並且可以設定過期時間。
Rocketmq-exporter 取得監控指標的流程如圖所示,exporter 透過 MQAdminExt 向 MQ 集群請求資料,請求到的資料透過 MetricService 標準化成 Prometheus 所需的格式,再透過 /metrics 介面暴露給 Promethus。 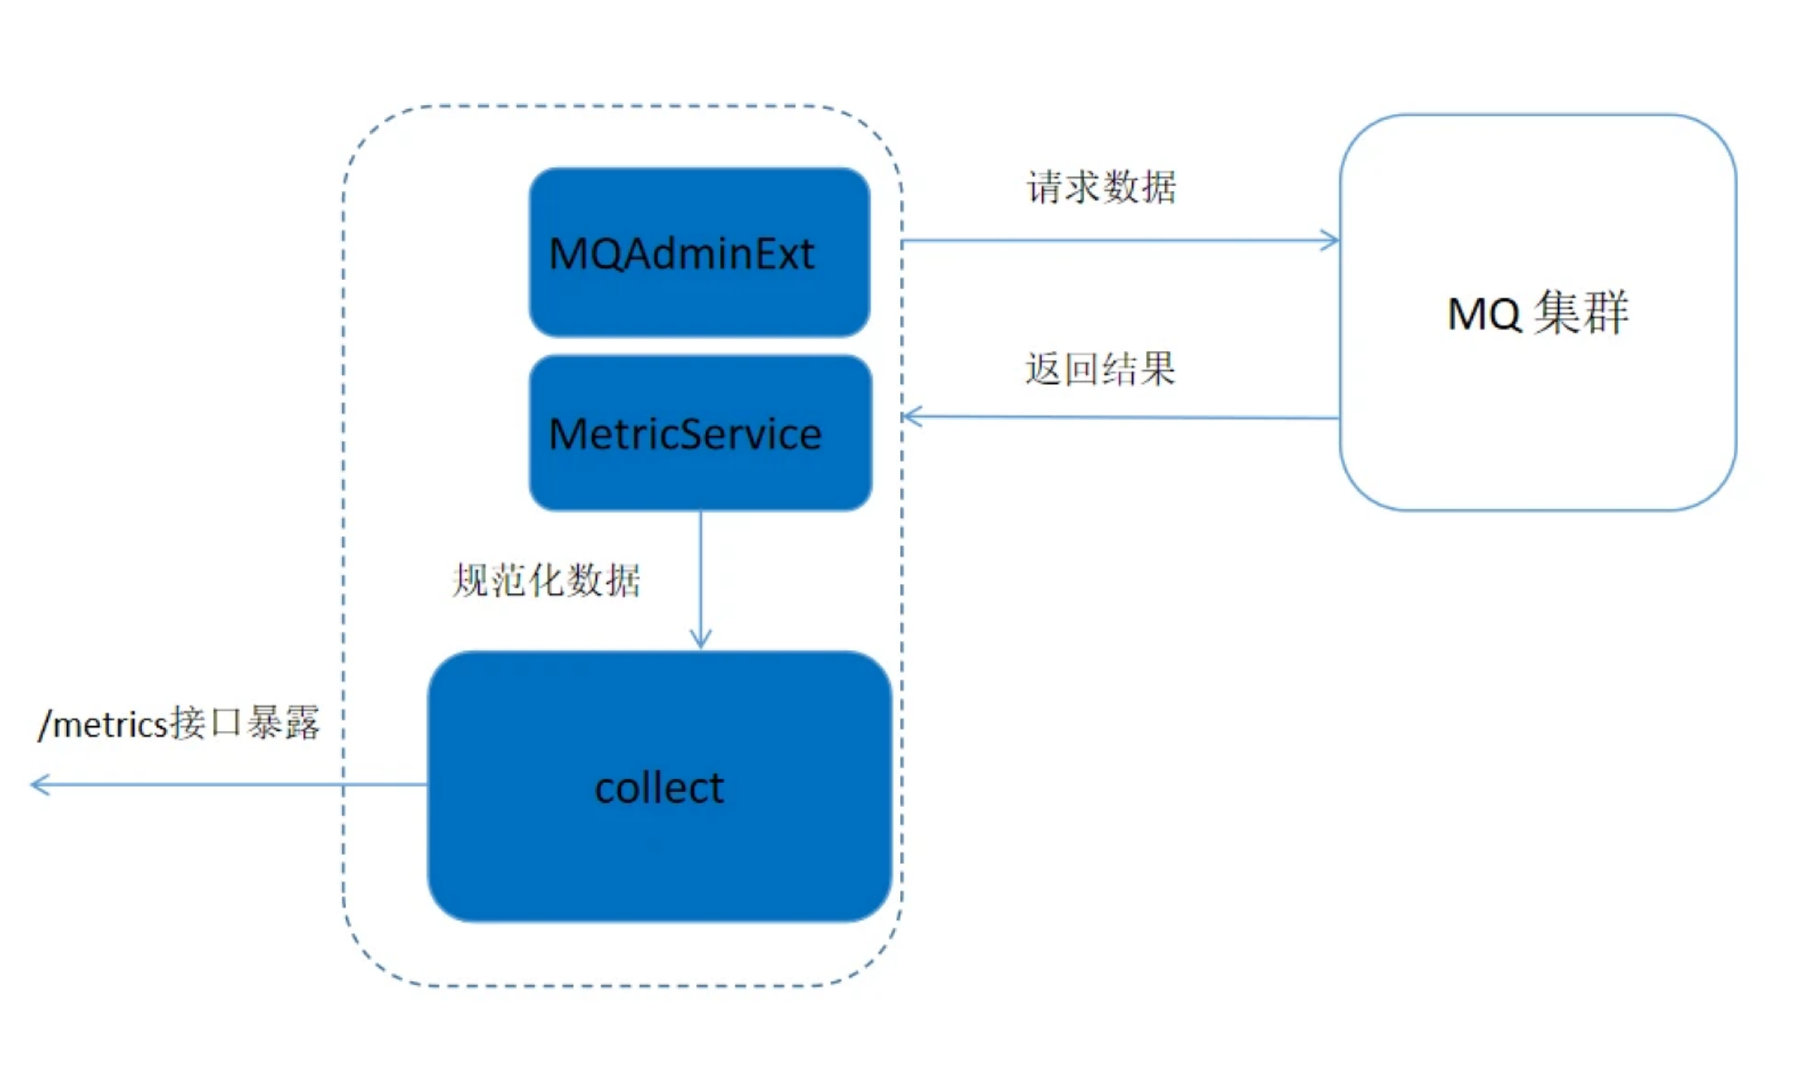
指標結構
Metric 類別位於 org.apache.rocketmq.expoter.model.metrics 套件中,本質上是一組實體類別,每個實體類別代表一種指標類型,總共有 14 個 Metric 類別。這些類別作為 87 個快取的鍵,並透過不同的標籤值加以區分。
- 與 broker 相關的指標類別 : BrokerRuntimeMetric、BrokerMetric、DLQTopicOffsetMetric、TopicPutNumMetric
- 與 consumer 相關的類別 : ConsumerRuntimeConsumeFailedMsgsMetric 、ConsumerRuntimeConsumeFailedTPSMetric 、ConsumerRuntimeConsumeOKTPSMetric、ConsumerRuntimeConsumeRTMetric、ConsumerRuntimePullRTMetric、ConsumerRuntimePullTPSMetric、ConsumerCountMetric、ConsumerMetric、ConsumerTopicDiffMetric
- 與 producer 相關的指標類別: ProducerMetric
Prometheus 拉取指標
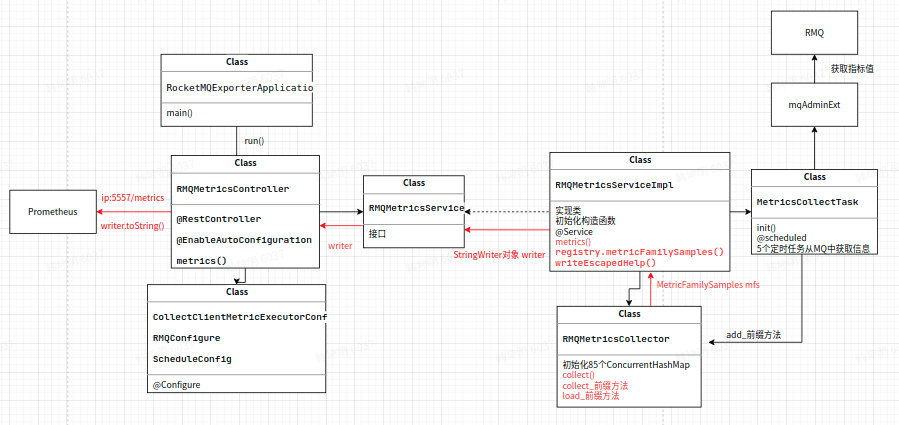
RocketMQ-exporter 專案與 Prometheus 相當於伺服器端與客戶端關係,RocketMQ-exporter 專案導入 Prometheus client 套件,在專案的 MetricFamilySamples 類別中指定要取得的資訊類型。Prometheus 向 exporter 請求指標,exporter 將資訊封裝成對應的類型後回傳給 Prometheus。
rocketmq-exporter 項目啟動後,會將 rocketmq 的各種指標收集到 mfs 物件中,當瀏覽器或 Prometheus 存取對應的介面時,會透過服務將 mfs 物件中的樣本產生成 Prometheus 支援的格式化資料,主要包含以下步驟
瀏覽器存取 ip:5557/metrics 呼叫 RMQMetricsController 類別中的 metrics 方法,其中 ip 為執行 rocketmq-exporter 項目的主機 IP
private void metrics(HttpServletResponse response) throws IOException {
    StringWriter writer = new StringWriter();
    metricsService.metrics(writer);
    response.setHeader("Content-Type", "text/plain; version=0.0.4; charset=utf-8");
    response.getOutputStream().print(writer.toString());
}
透過建立新的 StringWriter 物件來收集指標度量,再透過 MetricsService 類別中的 metrics 方法將 exporter 中的指標收集到 writer 物件中,最後將收集到的指標輸出到網頁
收集到的指標格式為
<metric name>{<label name>=<label value>, ...} <metric value>
範例:
rocketmq_group_diff{group="rmq_group_test_20220114",topic="fusion_console_tst",countOfOnlineConsumers="0",msgModel="1",} 23.0
MetricCollectTask 類別中的 5 個排程任務
MetricCollectTask 類別有 collectTopicOffset、collectConsumerOffset、collectBrokerStatsTopic、collectBrokerStats、collectBrokerRuntimeStats 等 5 個排程任務,用於收集 consumer offset 資訊、Broker 狀態資訊等,其 cron 表達式為:cron: 15 0/1 * * * ?,表示每分鐘收集一次,其核心功能是透過 mqAdminExt 物件取得叢集中的 broker 資訊,再加入對應的 87 個監控指標中,以 collectTopicOffset 為例
首先初始化 TopicList 物件,並透過 mqAdminExt.fetchAllTopicList() 方法取得叢集中的所有 topic 資訊
TopicList topicList = null;
try {
    topicList = mqAdminExt.fetchAllTopicList();
} catch (Exception ex) {
        log.error(String.format("collectTopicOffset-exception comes getting topic list from namesrv, address is %s",
            JSON.toJSONString(mqAdminExt.getNameServerAddressList())));
        return;
}
將 topic 加入 topicSet,並遍歷每個 topic,透過 mqAdminExt.examineTopicStats(topic) 函式檢查 topic 狀態
Set < String > topicSet = topicList != null ? topicList.getTopicList() : null;
for (String topic: topicSet) {
     TopicStatsTable topicStats = null;
     try {
         topicStats = mqAdminExt.examineTopicStats(topic);
     } catch (Exception ex) {
         log.error(String.format("collectTopicOffset-getting topic(%s) stats error. the namesrv address is %s",
             topic,
             JSON.toJSONString(mqAdminExt.getNameServerAddressList())));
         continue;}
初始化 topic 狀態集合、以 broker 為 key 存放 topic 資訊 offset 的雜湊表 brokerOffsetMap,以及以 broker 名稱為 key 存放更新時間戳記的雜湊表 brokerUpdateTimestampMap
Set<Map.Entry<MessageQueue, TopicOffset>> topicStatusEntries = topicStats.getOffsetTable().entrySet();
HashMap<String, Long> brokerOffsetMap = new HashMap<>();
HashMap<String, Long> brokerUpdateTimestampMap = new HashMap<>();
for (Map.Entry<MessageQueue, TopicOffset> topicStatusEntry : topicStatusEntries) {
    MessageQueue q = topicStatusEntry.getKey();
    TopicOffset offset = topicStatusEntry.getValue();
    if (brokerOffsetMap.containsKey(q.getBrokerName())) {
        brokerOffsetMap.put(q.getBrokerName(), brokerOffsetMap.get(q.getBrokerName()) + offset.getMaxOffset());
    } else {
        brokerOffsetMap.put(q.getBrokerName(), offset.getMaxOffset());
    }
    if (brokerUpdateTimestampMap.containsKey(q.getBrokerName())) {
        if (offset.getLastUpdateTimestamp() > brokerUpdateTimestampMap.get(q.getBrokerName())) {
            brokerUpdateTimestampMap.put(q.getBrokerName(), offset.getLastUpdateTimestamp());
        }
    } else {
        brokerUpdateTimestampMap.put(q.getBrokerName(),
        offset.getLastUpdateTimestamp());
    }
}
最後,遍歷 brokerOffsetMap 中的每個項目,透過 metricsService 取得 metricCollector 物件,並呼叫 RMQMetricsCollector 類別中的 addTopicOffsetMetric 方法,將對應的值加入 RMQMetricsCollector 類別中 87 個指標的快取之一
 Set<Map.Entry<String, Long>> brokerOffsetEntries = brokerOffsetMap.entrySet();
        for (Map.Entry<String, Long> brokerOffsetEntry : brokerOffsetEntries) {
            metricsService.getCollector().addTopicOffsetMetric(clusterName, brokerOffsetEntry.getKey(), topic,
                brokerUpdateTimestampMap.get(brokerOffsetEntry.getKey()), brokerOffsetEntry.getValue());
        }
    }
    log.info("topic offset collection task finished...." + (System.currentTimeMillis() - start));
}
Rocketmq-exporter 收集指標流程圖
快速入門
設定 application.yml
application.yml 中重要的設定包括
server.port 設定 Prometheus 監聽 rocketmq-exporter 的埠,預設為 5557。
rocketmq.config.webTelemetryPath 設定 Prometheus 取得指標的路徑,預設為 /metrics,可使用預設值。
rocketmq.config.enableACL 如果 RocketMQ 集群啟用 ACL 驗證,需要設定為 true,並在 accessKey、secretKey 設定對應的 ak、sk。
rocketmq.config.outOfTimeSeconds 用於設定指標及其值的儲存過期時間,超過此時間,快取中的 key 若未發生寫入變更,將會被刪除,一般可設定為 60s(Prometheus 取得指標的時間間隔應合理設定,只要過期時間大於等於 Prometheus 收集指標的時間間隔即可)。
task..cron 設定 exporter 透過排程任務從 broker 拉取指標的時間間隔,預設為 "15 0/1 * * ?",表示每分鐘的第 15 秒拉取一次指標。
啟動 exporter 應用程式
根據 Prometheus 官網設定啟動 Prometheus
設定 Prometheus 的 static_config: -targets 為 exporter 啟動的 IP 和埠,例如:localhost:5557。
存取 Prometheus 頁面
若 localhost 啟動於預設的 localhost:9090,可看到已收集的指標值,如下圖所示
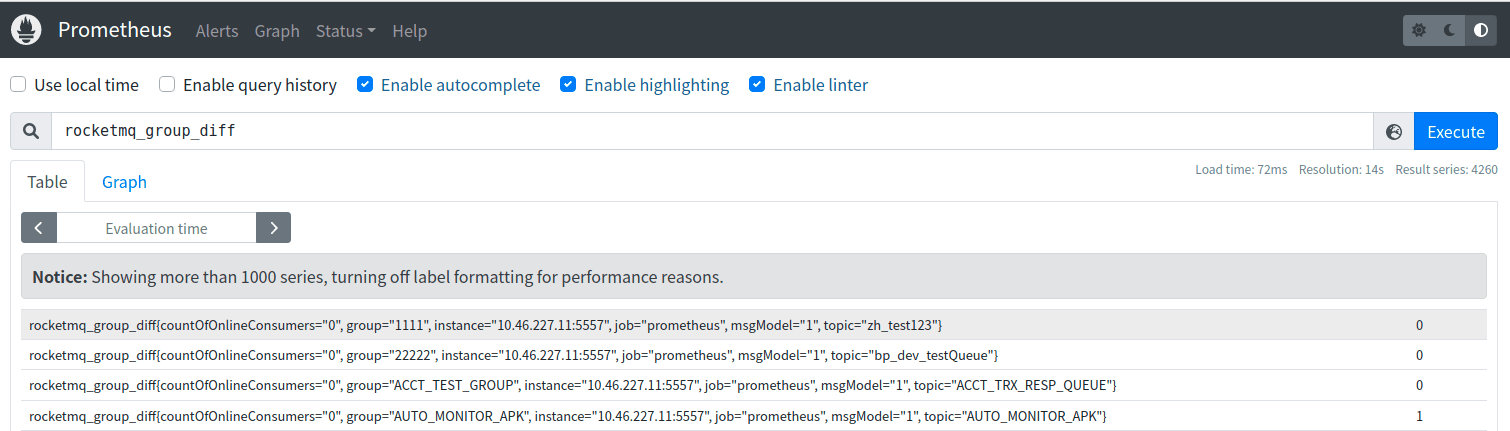
為了有更好的視覺化效果,觀察指標值變化的趨勢,Prometheus 搭配 Grafana 使用更佳!
可觀察性指標
可觀察性指標主要包含兩大類:伺服器端指標和客戶端指標,伺服器端指標是由伺服器直接產生的,客戶端指標則是在客戶端產生,並由伺服器透過 RPC 請求客戶端取得,客戶端指標又可細分為生產者指標和消費者指標,以下為全部 87 個可觀察性指標及其主要意義
Server metrics
Server metrics
| Metrics name | Definition | Corresponds to Broker metric name |
|---|---|---|
| rocketmq_broker_tps | Broker-level production TPS | |
| rocketmq_broker_qps | Broker-level consumption QPS | |
| rocketmq_broker_commitlog_diff | Broker group synchronization behind message size from slave node | |
| rocketmq_brokeruntime_pmdt_0ms | Server-side processing time for write request to completion of write(0ms) | putMessageDistributeTime |
| rocketmq_brokeruntime_pmdt_0to10ms | Server-side processing time for write request to completion of write(0~10ms) | |
| rocketmq_brokeruntime_pmdt_10to50ms | Server-side processing time for write request to completion of write(10~50ms) | |
| rocketmq_brokeruntime_pmdt_50to100ms | Server-side processing time for write request to completion of write(50~100ms) | |
| rocketmq_brokeruntime_pmdt_100to200ms | Server-side processing time for write request to completion of write(100~200ms) | |
| rocketmq_brokeruntime_pmdt_200to500ms | Server-side processing time for write request to completion of write(200~500ms) | |
| rocketmq_brokeruntime_pmdt_500to1s | Server-side processing time for write request to completion of write(500~1000ms) | |
| rocketmq_brokeruntime_pmdt_1to2s | Server-side processing time for write request to completion of write(1~2s) | |
| rocketmq_brokeruntime_pmdt_2to3s | Server-side processing time for write request to completion of write(2~3s) | |
| rocketmq_brokeruntime_pmdt_3to4s | Server-side processing time for write request to completion of write(3~4s) | |
| rocketmq_brokeruntime_pmdt_4to5s | Server-side processing time for write request to completion of write(4~5s) | |
| rocketmq_brokeruntime_pmdt_5to10s | Server-side processing time for write request to completion of write(5~10s) | |
| rocketmq_brokeruntime_pmdt_10stomore | Server-side processing time for write request to completion of write(> 10s) | |
| rocketmq_brokeruntime_dispatch_behind_bytes | The number of bytes of messages that have not been distributed yet (operations such as building indexes) | dispatchBehindBytes |
| rocketmq_brokeruntime_put_message_size_total | The total sum of the sizes of messages written to the broker | putMessageSizeTotal |
| rocketmq_brokeruntime_put_message_average_size | The average size of messages written to the broker | putMessageAverageSize |
| rocketmq_brokeruntime_remain_transientstore_buffer_numbs | The capacity of the queue in the TransientStorePool | remainTransientStoreBufferNumbs |
| rocketmq_brokeruntime_earliest_message_timestamp | The earliest timestamp of the messages stored by the broker | earliestMessageTimeStamp |
| rocketmq_brokeruntime_putmessage_entire_time_max | The maximum time it took to write messages to the broker since it started running | putMessageEntireTimeMax |
| rocketmq_brokeruntime_start_accept_sendrequest_time | The time at which the broker started accepting send requests | startAcceptSendRequestTimeStamp |
| rocketmq_brokeruntime_putmessage_times_total | The total number of times messages were written to the broker | putMessageTimesTotal |
| rocketmq_brokeruntime_getmessage_entire_time_max | The maximum time it took to process message pulls since the broker started running | getMessageEntireTimeMax |
| rocketmq_brokeruntime_pagecache_lock_time_mills | pageCacheLockTimeMills | |
| rocketmq_brokeruntime_commitlog_disk_ratio | The usage ratio of the disk where the commitLog is located | commitLogDiskRatio |
| rocketmq_brokeruntime_dispatch_maxbuffer | A value that the broker has not calculated and remains at 0 | dispatchMaxBuffer |
| rocketmq_brokeruntime_pull_threadpoolqueue_capacity | The capacity of the thread pool queue for processing pull requests. | pullThreadPoolQueueCapacity |
| rocketmq_brokeruntime_send_threadpoolqueue_capacity | Capacity of the queue in the thread pool handling pull requests | sendThreadPoolQueueCapacity |
| rocketmq_brokeruntime_query_threadpool_queue_capacity | Capacity of the queue in the thread pool handling query requests | queryThreadPoolQueueCapacity |
| rocketmq_brokeruntime_pull_threadpoolqueue_size | Actual size of the queue in the thread pool handling pull requests | pullThreadPoolQueueSize |
| rocketmq_brokeruntime_query_threadpoolqueue_size | Actual size of the queue in the thread pool handling query requests | queryThreadPoolQueueSize |
| rocketmq_brokeruntime_send_threadpool_queue_size | Actual size of the queue in the thread pool handling send requests | sendThreadPoolQueueSize |
| rocketmq_brokeruntime_pull_threadpoolqueue_headwait_timemills | Waiting time for the head task in the queue in the thread pool handling pull requests | pullThreadPoolQueueHeadWaitTimeMills |
| rocketmq_brokeruntime_query_threadpoolqueue_headwait_timemills | Waiting time for the head task in the queue in the thread pool handling query requests | queryThreadPoolQueueHeadWaitTimeMills |
| rocketmq_brokeruntime_send_threadpoolqueue_headwait_timemills | Waiting time for the head task in the queue in the thread pool handling send requests | sendThreadPoolQueueHeadWaitTimeMills |
| rocketmq_brokeruntime_msg_gettotal_yesterdaymorning | Total number of times messages were read up until midnight last night | msgGetTotalYesterdayMorning |
| rocketmq_brokeruntime_msg_puttotal_yesterdaymorning | Total number of times messages were written up until midnight last night | msgPutTotalYesterdayMorning |
| rocketmq_brokeruntime_msg_gettotal_todaymorning | Total number of times messages were read up until midnight tonight | msgGetTotalTodayMorning |
| rocketmq_brokeruntime_msg_puttotal_todaymorning | Total number of times messages were written up until midnight tonight | putMessageTimesTotal |
| rocketmq_brokeruntime_msg_put_total_today_now | The number of messages written to each broker so far. | msgPutTotalTodayNow |
| rocketmq_brokeruntime_msg_gettotal_today_now | The number of messages read from each broker so far. | msgGetTotalTodayNow |
| rocketmq_brokeruntime_commitlogdir_capacity_free | The available space in the directory where the commitLog are stored. | commitLogDirCapacity |
| rocketmq_brokeruntime_commitlogdir_capacity_total | The total space in the directory where the commit logs are stored. | |
| rocketmq_brokeruntime_commitlog_maxoffset | The maximum offset of the commitLog. | commitLogMaxOffset |
| rocketmq_brokeruntime_commitlog_minoffset | The minimum offset of the commitLog. | commitLogMinOffset |
| rocketmq_brokeruntime_remain_howmanydata_toflush | remainHowManyDataToFlush | |
| rocketmq_brokeruntime_getfound_tps600 | The average TPS of messages received during getMessage in the past 600 seconds. | getFoundTps |
| rocketmq_brokeruntime_getfound_tps60 | The average TPS of messages received during getMessage in the past 60 seconds. | |
| rocketmq_brokeruntime_getfound_tps10 | The average TPS of messages received during getMessage in the past 10 seconds. | |
| rocketmq_brokeruntime_gettotal_tps600 | The average TPS of getMessage calls in the past 600 seconds. | getTotalTps |
| rocketmq_brokeruntime_gettotal_tps60 | The average TPS of getMessage calls in the past 60 seconds. | |
| rocketmq_brokeruntime_gettotal_tps10 | The average TPS of getMessage calls in the past 10 seconds. | |
| rocketmq_brokeruntime_gettransfered_tps600 | getTransferedTps | |
| rocketmq_brokeruntime_gettransfered_tps60 | ||
| rocketmq_brokeruntime_gettransfered_tps10 | ||
| rocketmq_brokeruntime_getmiss_tps600 | Average TPS for getMessage with no messages obtained in the past 600 seconds | getMissTps |
| rocketmq_brokeruntime_getmiss_tps60 | Average TPS for getMessage with no messages obtained in the past 60 seconds | |
| rocketmq_brokeruntime_getmiss_tps10 | Average TPS for getMessage with no messages obtained in the past 10 seconds | |
| rocketmq_brokeruntime_put_tps600 | Average TPS for message write operations in the past 600 seconds | putTps |
| rocketmq_brokeruntime_put_tps60 | Average TPS for message write operations in the past 60 seconds | |
| rocketmq_brokeruntime_put_tps10 | Average TPS for message write operations in the past 10 seconds |
Producer metrics
Producer metrics
| Metrics name | Definition |
|---|---|
| rocketmq_producer_offset | The maximum offset of the topic at the current time |
| rocketmq_topic_retry_offset | The maximum offset of the retry topic at the current time |
| rocketmq_topic_dlq_offset | The maximum offset of the dead letter topic at the current time |
| rocketmq_producer_tps | The production TPS of the topic on a Broker group |
| rocketmq_producer_message_size | The TPS of the production message size of the topic on a Broker group |
| rocketmq_queue_producer_tps | Queue-level production TPS |
| rocketmq_queue_producer_message_size | Queue-level production TPS of message size |
Consumer metrics
Consumer metrics
| Metrics name | Definition |
|---|---|
| rocketmq_group_diff | Consumer group message accumulation message count |
| rocketmq_group_retrydiff | Consumer group retry queue accumulation message count |
| rocketmq_group_dlqdiff | Consumer group dead letter queue accumulation message count |
| rocketmq_group_count | Number of consumers in the consumer group |
| rocketmq_client_consume_fail_msg_count | Number of times consumers in the consumer group have failed to consume in the past 1 hour |
| rocketmq_client_consume_fail_msg_tps | Consumer group consumer failure TPS |
| rocketmq_client_consume_ok_msg_tps | Consumer group consumer success TPS |
| rocketmq_client_consume_rt | Time taken for a message to be consumed after it has been pulled |
| rocketmq_client_consumer_pull_rt | Time taken for a client to pull a message |
| rocketmq_client_consumer_pull_tps | Client pull message TPS |
| rocketmq_consumer_tps | Consumption TPS of subscription group on each Broker group |
| rocketmq_group_consume_tps | Current consumption TPS of subscription group (aggregated by broker for rocketmq_consumer_tps) |
| rocketmq_consumer_offset | The current consumption Offset of the subscription group in a broker group |
| rocketmq_group_consume_total_offset | The current consumption Offset of the subscription group (aggregated by broker for rocketmq_consumer_offset) |
| rocketmq_consumer_message_size | The TPS of the subscription group consuming message size in a broker group |
| rocketmq_send_back_nums | The number of times the subscription group in a broker group has failed to consume and written to the retry message |
| rocketmq_group_get_latency_by_storetime | The consumption delay of the consumer group, the difference between the current time and when the exporter gets the message. |